There has been a lot of buzz lately around Microsoft’s “Power Business Intelligence” (Power BI) features – PowerPivot, Power View, Power Map, and Power Query. With so many “Power” features available, how do you know which one to use and how does one get started? The path to Business Intelligence greatness starts with Microsoft Excel – what I like to call the analyst’s “best friend.” Let’s discover how Excel provides you a set of powerful features to provide your organization with complex Business Intelligence.
PowerPivot
PowerPivot was Microsoft’s ground breaking feature in 2010 that provided the ability to import multiple data sources into a single Excel spreadsheet, create relationships between the data sources, and perform self-service ad-hoc analysis using a simple PivotTable. The data sources can be an Excel spreadsheet, a text file, almost any database platform, and many other data types. After a connection is established to the data, it is as easy as clicking the “Refresh” button in Excel to see the latest data updates; gone are the days of having to re-export information into Excel or a text file! Sharing of these PowerPivot enabled spreadsheets is accomplished by uploading to Power BI, SharePoint, e-mail distribution, or saving the files in a central network location.
With Microsoft Excel 2013, PowerPivot is now a built-in add-on (you need to enable it in Excel). If you are using Excel 2010, you can download a PowerPivot add-on for FREE from Microsoft.
Power View
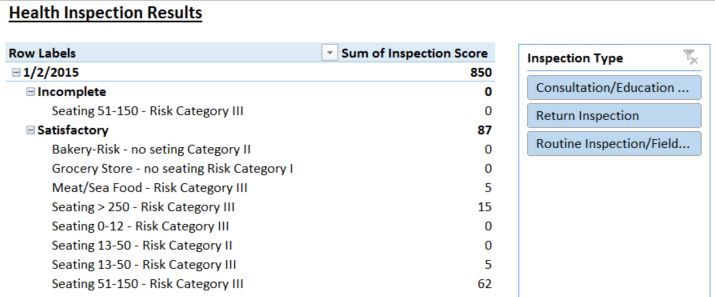
Power View is an all-in-one dashboard creation feature that allows you to create interactive data visualizations in Excel. Simply create a PowerPivot connection to your data and then start dragging and dropping fields into interactive reports and analytical views. With Power View, you create related “tiles” of charts, maps, and tables. Because each element in a tile is related, you can click a section of a pie and then drill down into relevant insights. You can take these Power View dashboards and export them to presentation formats such as PowerPoint or use Power View as your interactive presentation.
Similar to PowerPivot, Power View is a built-in add-on for Excel 2013, no additional downloads are needed. If you do not have Excel 2013, you can still create Power View files as long as you have one of the following: 1. SharePoint 2010 or newer with SQL Server 2012 Business Intelligence or newer 2. Power BI sites in Office 365.

Power Map
Power Map is an interactive Excel add-on for displaying geographical information. Using Power View, you can represent your data on a two-dimensional map. With Power Map, you can take your data one step further by showing geographical information on a three-dimensional map of the world or a custom X/Y coordinate map. To illustrate data over time, you can add a time component and Power Map will animate changes over time. Additionally, you can create multiple views of your information and save them as storyboard scenes. After your perfect Power Map visualization is created, add music and export it to a distributable movie format that can be used to amaze an audience.
If you have an on-premise version of Microsoft Office Excel 2013, you can download Power Map for free from Microsoft. However, if you have an Office 365 version of Excel 2013, Power Map is already built-in and you automatically receive the latest updates from Microsoft.

Power Query
Power Query is a data analysis feature for Excel that allows you to easily connect to a variety of data sources, transform the data, and share saved queries. Notable data sources that are specific to Power Query include Hadoop Distributed File System (HDFS), Facebook, SAP BusinessObjects BI Universe and Salesforce. With these additional sources, you can create PowerPivot data models and visualizations with a few clicks.
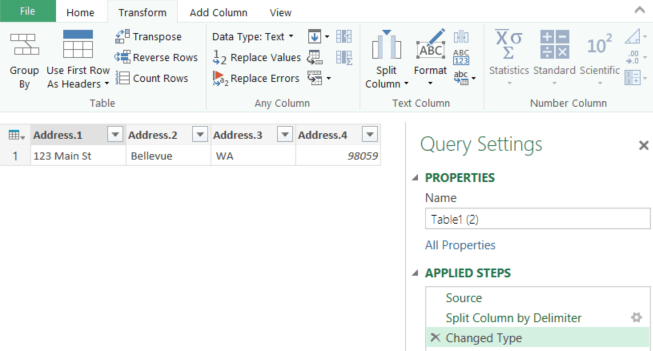
Power Query provides data transformations that previously required extensive Excel formula manipulations or an ETL (Extract, Transform, and Load) developer. The transformations include the ability to pivot, unpivot, split by delimiter, remove extra white space (also known as cleaning), and many more. A common transformation is parsing a mailing address to obtain the State, City, and Zip Code.
Take for example the address: 123 Main St, Bellevue, WA, 98059
To separate the street number from the above address, you would need to write an Excel formula to parse the data by spaces.
=IF(ISERROR(VALUE(LEFT(A2,1))),””,LEFT(A2,FIND(” “,A2)-1))
To get the City, State, or Zip Code, it would require additional complex Excel formulas.
Another option is to convert Text to Columns from the Data menu but this could overwrite adjacent columns.
A simpler method is to use Power Query’s delimiter functions.
1. Click Split Column
2. Select the delimiter
You can download Power Query for Excel for FREE. If you have Office 365, all you need to do is enable the Power Query feature in Excel.
Power BI Summary
Now you are aware of several powerful Business Intelligence features in Excel that can radically transform the way you work and can shape your company’s Business Intelligence. To connect multiple data sources into a single data model, PowerPivot is your best friend. If you need to present powerful, interactive dashboards, consider Power View and/or Power Map. If you consistently are trying to merge and transform data from external sources, look no further than Power Query. If you need assistance or want more information about these Business Intelligence features, please contact Affirma Consulting.